Econ 265: Introduction to Econometrics

Topic 5: Inference

Moshi Alam

Introduction

Population model: \(y_i = \beta_0 + \beta_1 x_{1i} + \beta_2 x_{2i} + \ldots + \beta_k x_{ki} + u_i\).

  • estimate the parameters using OLS
  • obtain the standard errors of the OLS estimates
  • And imlement them in R

Now, based on sample estimates and standard errors. we will answer questions like:

  • Whether the estimated coefficient is statistically significant at any confidence level?
    • Means: Whether the true population parameter is different from zero at any confidence level?
library(wooldridge)
wage_data <- wage1
reg1 <- lm(log(wage) ~ educ + exper + tenure, data = wage_data)
summary(reg1)

Call:
lm(formula = log(wage) ~ educ + exper + tenure, data = wage_data)

Residuals:
     Min       1Q   Median       3Q      Max 
-2.05802 -0.29645 -0.03265  0.28788  1.42809 

Coefficients:
            Estimate Std. Error t value Pr(>|t|)    
(Intercept) 0.284360   0.104190   2.729  0.00656 ** 
educ        0.092029   0.007330  12.555  < 2e-16 ***
exper       0.004121   0.001723   2.391  0.01714 *  
tenure      0.022067   0.003094   7.133 3.29e-12 ***
---
Signif. codes:  0 '***' 0.001 '**' 0.01 '*' 0.05 '.' 0.1 ' ' 1

Residual standard error: 0.4409 on 522 degrees of freedom
Multiple R-squared:  0.316, Adjusted R-squared:  0.3121 
F-statistic: 80.39 on 3 and 522 DF,  p-value: < 2.2e-16
Refreshers from Econ 160

Normal Distributions

Random variable: \(X \sim N(\mu, \sigma^2)\)

PDF: \(f(X = x) = \frac{1}{\sqrt{2\pi}\sigma} e^{-\frac{1}{2}(\frac{x-\mu}{\sigma})^2}\), where

  • \(E(X) = \mu\) is the mean and \(Var(X) = \sigma^2\) is the variance
  • The distirbution is symmetric around \(\mu\)

Properties:

  • \(Z = \frac{X - \mu}{\sigma}\) is the standard normal random variable with mean 0 and variance 1
  • Transformation of X such as \(aX + b \sim N(a\mu + b, a^2\sigma^2)\)
  • If X & Y are independent normal random variables, then \(X + Y \sim N(\mu_X + \mu_Y, \sigma_X^2 + \sigma_Y^2)\)
  • Any linear combination of normal random variables is normal

\(\chi^2_n\) and \(t_n\)

\(Z_i \sim N(0,1)\) for \(i = 1, 2, \ldots, n\) independent standard normal random variables

  • The sum of squared independent standard normal random variables follows a chi-square distribution with \(n\) d.o.f.. Let \(Q = \sum_{i=1}^n Z_i^2\) \[Q \sim \chi^2_n\]
    • \(E(Q) = n\) and \(Var(Q) = 2n\)
  • The ratio of a standard normal random variable and a chi-square random variable follows a t-distribution. Let \(T = \frac{Z}{\sqrt{Q/n}}\) \[T \sim t_n\]
    • \(E(T) = 0\) and \(Var(T) = n/(n-2)\) for \(n > 2\)
    • Shape of the t-distribution is similar to the normal distribution but more spread out (heavier tails). Check out Figure B-9 in Math Refresher B
  • As sample size increases, the t-distribution approaches the standard normal distribution

sampling distributions

The distribution of the sample statistic (e.g., sample mean, sample variance, regression coefficients) over repeated independent sampling

  • Sampling variability: The variability of the sample statistic across different samples
  • Standard error: The estimate of the standard deviation of the sampling distribution of a sample statistic
  • Central Limit Theorem (CLT): Let \(\{X_1, X_2, \ldots, X_n\}\) be a random sample of size \(n\) from a population with mean \(\mu\) and variance \(\sigma^2\). Then, as \(n\) approaches infinity, \(\bar{X} \sim N(\mu, \sigma^2/n)\) so that \(\frac{\bar{X} - \mu}{\sigma/\sqrt{n}} \sim N(0,1)\)
  • Recall from Econ 160:
    • The sampling distribution of the sample proportion \(\hat{p}\) approaches a normal distribution with mean \(p\) and variance \(p(1-p)/n\).
    • The sampling distribution of sample means follows a \(t\)-distribution with \(n-1\) degrees of freedom

Hypothesis testing

  • Null hypothesis \(H_0\): A statement about the population parameter that is assumed to be true and test against an alternative hypothesis \(H_1\)
  • Type I error: Rejecting the \(H_0\) when it is true
  • Type II error: Failing to reject the \(H_0\) when it is false
  • Significance level: The probability of committing a Type I error, denoted by \(\alpha\)
  • Confidence interval: A range of values where we are \(1-\alpha\) confident that the true population parameter lies within
    • estimate \(\pm\) critical value \(\times\) standard error
    • What happens if the CI contains the hypothesized value?
  • Tests can only allow us to reject the \(H_0\) or fail to reject the \(H_0\) but never accept the \(H_0\). Why?

  • p-value: The probability of observing the sample (statistic) if \(H_0\) were true
    • What does it mean when p-value is less than \(\alpha\)?
  • Critical value: The value that separates the rejection region from the non-rejection region in hypothesis testing
    • What is critical value for a two-tailed test with \(\alpha = 0.05\)?
  • Critical region: The range of values that leads to the rejection of the \(H_0\)
  • One-tailed test: A hypothesis test that tests the \(H_0\) in one direction
  • Two-tailed test: A hypothesis test that tests the \(H_0\) in both directions

Hypothesis testing in MLR

Big picture

  • To test hypotheses about regression coeffcients \(\hat{\beta}_j\), we need to know:
    • the sampling distribution of the \(\hat{\beta}_j\)’s
  • Once we have the sampling distribution of the \(\hat{\beta}_j\)
    • We can get the standard errors of the \(\hat{\beta}_j\)’s
      • Estimates of the standard deviation of the sampling distribution of the \(\hat{\beta}_j\)’s
  • We can make inferences about the population parameters \(\beta_j\)’s’ based on
    • the estimates, standard errors and the sampling distribution of the \(\hat{\beta}_j\)’s
  • Turns out that under some assumptions, the \(\hat{\beta}_j\)’s follow a \(t\) distribution (in practice)
    • It requires an assumption on the distribution of the errors \(u_i\)’s MLR.6

Assumption MLR.6:

Assumption MLR.6: Normality of Errors

The population error \(u_i\) is normally distributed with mean 0 and constant variance \(\sigma^2\) and independent of the regressors for all \(i = 1, 2, \ldots, n\) \[u_i \sim N(0, \sigma^2)\]

  • This directly implies MLR.4 and MLR.5

  • The full set of assumptions MLR.1-MLR.6 are called the classical linear model (CLM) assumptions. Together they imply: \[y \mid x_1, \ldots x_k \sim N(\beta_0 + \beta_1 x_{1i} + \ldots + \beta_k x_{ki}, \sigma^2)\]

  • Hard to defend this very strong assumption

    • Thankfully not required for large samples (Ch-5)

Theorem 4.1: Normality of OLS Estimators

Under the CLM assumptions MLR. 1 through MLR.6, conditional on the sample values of the independent variables,

\[ \hat{\beta}_j \sim \operatorname{Normal}\left(\beta_j , \operatorname{Var}\left(\hat{\beta}_j\right)\right), \]

where \(\operatorname{Var}\left(\hat{\beta}_{j}\right)\)was given in Chapter 3 [equation (3.51)]. Therefore,

\[ \frac{\hat{\beta}_j-\beta_j}{\operatorname{sd}\left(\hat{\beta}_j\right)} \sim \operatorname{Normal}(0,1) \quad \text { for } j=0,1, \ldots, k \]

Theorem 4.2: t-distribution of OLS Estimates

Under the CLM assumptions MLR. 1 through MLR.6, conditional on the sample values of the independent variables,

\[ \frac{\hat{\beta}_j-\beta_j}{\operatorname{se}\left(\hat{\beta}_j\right)} \sim t_{n-k-1} \quad \text { for } j=0,1, \ldots, k \]

where \(k+1\) is the number of unknown parameters in the population model and \(n-k-1\) is the d.o.f.

Observe the differences!

Single hypothesis testing

Single hypothesis testing

Inference on the \(j\)th population parameter \(\beta_j\):

  • Null hypothesis: \(H_0: \beta_j = b\), where \(b\) is a hypothesized value typically 0
  • Note that this is a test on the \(j\)th population parameter while holding all other parameters constant
  • One-sided alternative: \(H_1: \beta_j > b\) or \(H_1: \beta_j < b\)
  • Two-sided alternative: \(H_1: \beta_j \neq b\)
  • set b= 0. Test statistic: \(t_{\hat{\beta}_j} = \frac{\hat{\beta}_j - b}{\operatorname{se}(\hat{\beta}_j)} = \frac{\hat{\beta}_j}{\operatorname{se}(\hat{\beta}_j)}\)
  • We know that the sampling distribution of \(t_{\hat{\beta}_j}\) follows…

One-sided test

Fix a level of significance \(\alpha\) (e.g., 0.05)

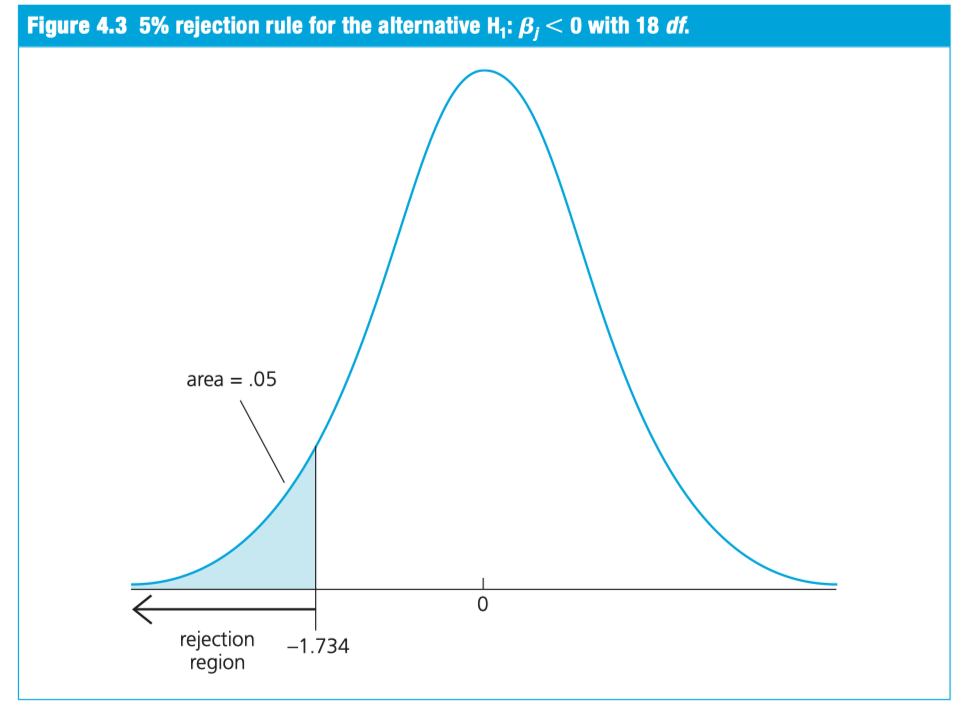
  • alternative: \(H_1: \beta_j > 0\) (or \(H_1: \beta_j < 0)\)
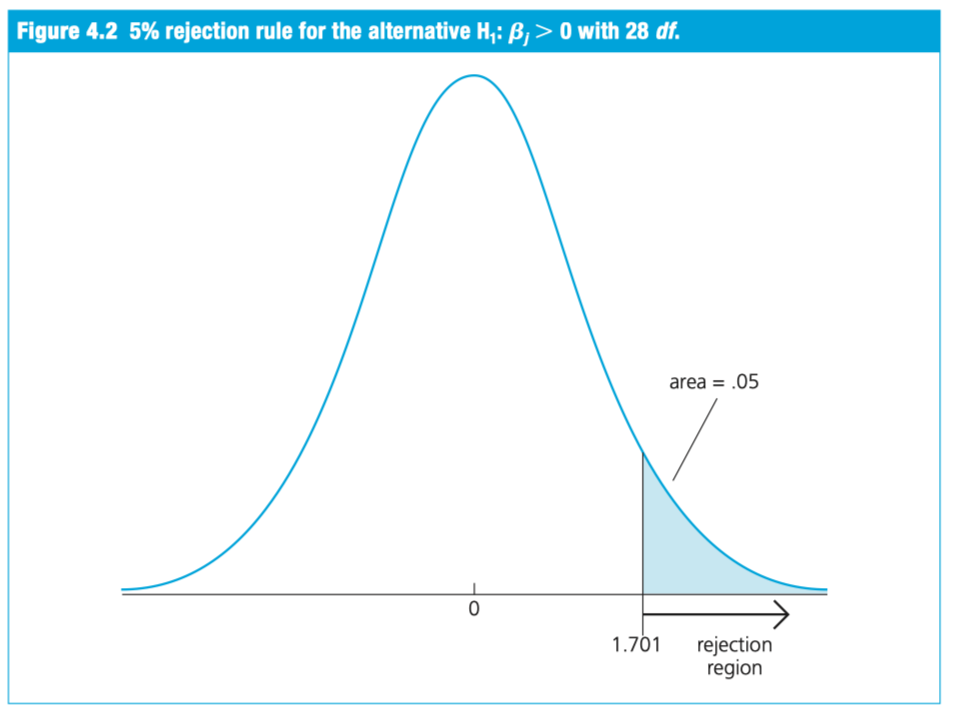
    • Reject \(H_0\) if \(t_{\hat{\beta}_j} > t_{\alpha, n-k-1}^*\)
    • p-value = \(P(T > t_{\hat{\beta}_j})\) where \(T \sim t_{n-k-1}\)
    • Confidence interval: \(\hat{\beta}_j \pm t_{\alpha, n-k-1}^* \times \operatorname{se}(\hat{\beta}_j)\)
  • For large samples, t-distribution \(\rightarrow\) standard normal
    • the critical value \(\approx \pm 1.65\) for \(\alpha = 0.05\)

One-sided test (right)

One-sided test (left)

Examples

library(wooldridge)
nrow(meap93) - 4 - 1 # DOF
[1] 403
summary(lm(math10 ~ totcomp + staff + enroll, data=meap93))

Call:
lm(formula = math10 ~ totcomp + staff + enroll, data = meap93)

Residuals:
    Min      1Q  Median      3Q     Max 
-22.235  -7.008  -0.807   6.097  40.689 

Coefficients:
              Estimate Std. Error t value Pr(>|t|)    
(Intercept)  2.2740209  6.1137938   0.372    0.710    
totcomp      0.0004586  0.0001004   4.570 6.49e-06 ***
staff        0.0479199  0.0398140   1.204    0.229    
enroll      -0.0001976  0.0002152  -0.918    0.359    
---
Signif. codes:  0 '***' 0.001 '**' 0.01 '*' 0.05 '.' 0.1 ' ' 1

Residual standard error: 10.24 on 404 degrees of freedom
Multiple R-squared:  0.05406,   Adjusted R-squared:  0.04704 
F-statistic: 7.697 on 3 and 404 DF,  p-value: 5.179e-05
library(wooldridge)
nrow(meap93) - 4 - 1 # DOF
[1] 403
summary(lm(math10 ~ log(totcomp) + log(staff) + log(enroll), data=meap93))

Call:
lm(formula = math10 ~ log(totcomp) + log(staff) + log(enroll), 
    data = meap93)

Residuals:
    Min      1Q  Median      3Q     Max 
-22.735  -6.838  -0.835   6.139  39.718 

Coefficients:
              Estimate Std. Error t value Pr(>|t|)    
(Intercept)  -207.6649    48.7031  -4.264 2.50e-05 ***
log(totcomp)   21.1550     4.0555   5.216 2.92e-07 ***
log(staff)      3.9800     4.1897   0.950   0.3427    
log(enroll)    -1.2680     0.6932  -1.829   0.0681 .  
---
Signif. codes:  0 '***' 0.001 '**' 0.01 '*' 0.05 '.' 0.1 ' ' 1

Residual standard error: 10.18 on 404 degrees of freedom
Multiple R-squared:  0.06538,   Adjusted R-squared:  0.05844 
F-statistic:  9.42 on 3 and 404 DF,  p-value: 4.974e-06

Two-sided test

Fix a level of significance \(\alpha\) (e.g., 0.05)

  • alternative: \(H_1: \beta_j \neq 0\)
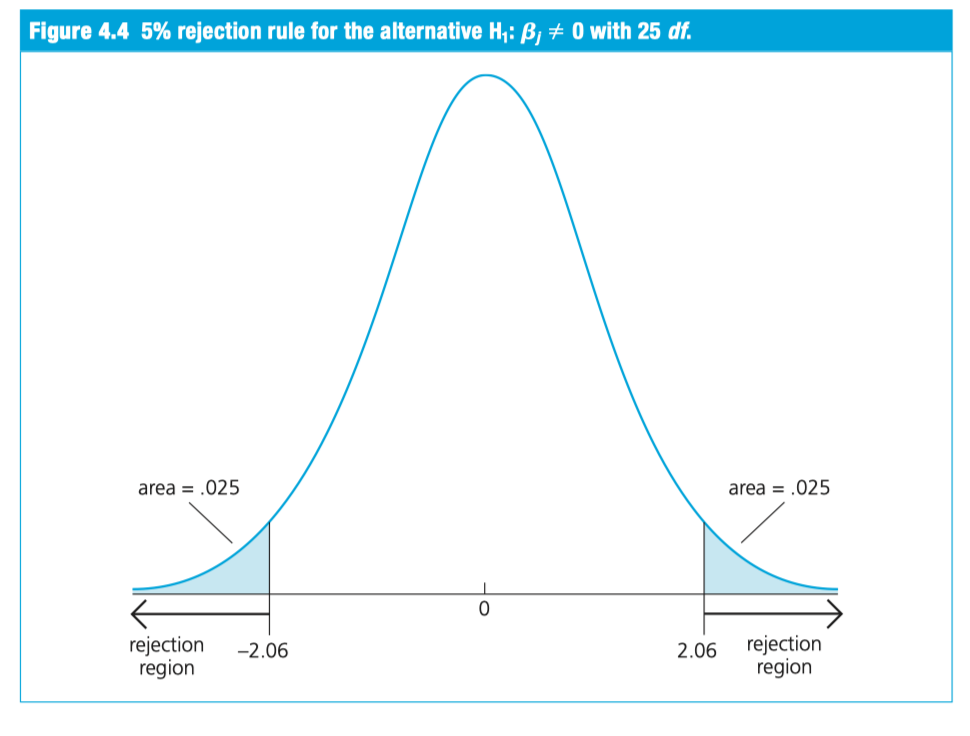
    • Reject \(H_0\) if \(|t_{\hat{\beta}_j}| > t_{\alpha/2, n-k-1}^*\)
    • p-value = \(P(|T| > |t_{\hat{\beta}_j}|)\)
    • Confidence interval: \(\hat{\beta}_j \pm t_{\alpha/2, n-k-1}^* \times \operatorname{se}(\hat{\beta}_j)\)
  • For large samples, t-distribution \(\rightarrow\) standard normal
    • the critical value \(\approx \pm 1.96\) for \(\alpha = 0.05\)

Two-sided test

Examples

library(wooldridge)
nrow(meap93) - 4 - 1 # DOF
[1] 403
summary(lm(math10 ~ log(totcomp) + log(staff) + log(enroll), data=meap93))

Call:
lm(formula = math10 ~ log(totcomp) + log(staff) + log(enroll), 
    data = meap93)

Residuals:
    Min      1Q  Median      3Q     Max 
-22.735  -6.838  -0.835   6.139  39.718 

Coefficients:
              Estimate Std. Error t value Pr(>|t|)    
(Intercept)  -207.6649    48.7031  -4.264 2.50e-05 ***
log(totcomp)   21.1550     4.0555   5.216 2.92e-07 ***
log(staff)      3.9800     4.1897   0.950   0.3427    
log(enroll)    -1.2680     0.6932  -1.829   0.0681 .  
---
Signif. codes:  0 '***' 0.001 '**' 0.01 '*' 0.05 '.' 0.1 ' ' 1

Residual standard error: 10.18 on 404 degrees of freedom
Multiple R-squared:  0.06538,   Adjusted R-squared:  0.05844 
F-statistic:  9.42 on 3 and 404 DF,  p-value: 4.974e-06

Computing p-values

  • p-value is the probability of observing the sample (statistic) if \(H_0\) is true
  • Indeed you can do this using a table.
  • But R can do this for you
t_value <- 2.5    #  t-value
df <- 100         #  degrees of freedom

# Two-tailed p-value
p_value <- 2 * (1 - pt(abs(t_value), df))
print(p_value)
[1] 0.01404579
# One-tailed p-value (right tail)
p_right <- 1 - pt(t_value, df)
print(p_right)
[1] 0.007022895
# One-tailed p-value (left tail)
p_left <- pt(t_value, df)
print(p_left)
[1] 0.9929771

Testing Linear combinations

\[log(wage_i) = \beta_0 + \beta_1 jc_i + \beta_2 univ_i + \beta_3 exper_i + u_i\]

library(wooldridge)
summary(lm(lwage ~ jc + univ + exper, data = twoyear))

Call:
lm(formula = lwage ~ jc + univ + exper, data = twoyear)

Residuals:
     Min       1Q   Median       3Q      Max 
-2.10362 -0.28132  0.00551  0.28518  1.78167 

Coefficients:
             Estimate Std. Error t value Pr(>|t|)    
(Intercept) 1.4723256  0.0210602  69.910   <2e-16 ***
jc          0.0666967  0.0068288   9.767   <2e-16 ***
univ        0.0768762  0.0023087  33.298   <2e-16 ***
exper       0.0049442  0.0001575  31.397   <2e-16 ***
---
Signif. codes:  0 '***' 0.001 '**' 0.01 '*' 0.05 '.' 0.1 ' ' 1

Residual standard error: 0.4301 on 6759 degrees of freedom
Multiple R-squared:  0.2224,    Adjusted R-squared:  0.2221 
F-statistic: 644.5 on 3 and 6759 DF,  p-value: < 2.2e-16
  • Does attending \(jc_i\) has lower effect on wages as going to university \(univ_i\)?
  • What are we testing?

\[log(wage_i) = \beta_0 + \beta_1 jc_i + \beta_2 univ_i + \beta_3 exper_i + u_i\] \(H_0: \beta_1 = \beta_2\) and \(H_1: \beta_1 < \beta_2\)

  • Call \(\beta_1 - \beta_2 = \theta\) and so \(H_0: \theta = 0\) and \(H_1: \theta < 0\)
  • Test statistic: \(t_{\hat{\theta}} = \frac{\hat{\theta}}{\operatorname{se}(\hat{\theta})} = \frac{\hat{\beta}_1 - \hat{\beta}_2}{\operatorname{se}(\hat{\beta}_1-\hat{\beta}_2)} = \frac{\hat{\beta}_1 - \hat{\beta}_2}{\sqrt{\operatorname{se}(\hat{\beta}_1)^2 + \operatorname{se}(\hat{\beta}_2)^2 + 2\widehat{\operatorname{cov}(\hat{\beta}_1, \hat{\beta}_2)}}}\)
    • Reject \(H_0\)
      • if \(t_{\hat{\theta}} < t_{\alpha, n-k-1}^*\)
      • Or if p-value = \(P(T < t_{\hat{\theta}})\) where \(T \sim t_{n-k-1}\) is less than \(\alpha\)
      • Or if CI: \([\hat{\theta} \pm t_{\alpha, n-k-1}^* \times \operatorname{se}(\hat{\theta})]\) does not contain zero
  • Easy to calculate \(t_{\hat{\theta}}\) if \(\widehat{\operatorname{cov}(\hat{\beta}_1, \hat{\beta}_2)}\) is known

Implementation

  • \[log(wage_i) = \beta_0 + \beta_1 jc_i + \beta_2 univ_i + \beta_3 exper_i + u_i\]
  • \[log(wage_i) = \beta_0 + (\theta + \beta_2) jc_i + \beta_2 univ_i + \beta_3 exper_i + u_i\]
  • \[log(wage_i) = \beta_0 + \theta jc_i + \beta_2 (jc_i + univ_i) + \beta_3 exper_i + u_i\]

R code

\[log(wage_i) = \beta_0 + \theta jc_i + \beta_2 (jc_i + univ_i) + \beta_3 exper_i + u_i\]

library(wooldridge)
summary(lm(lwage ~ jc + I(jc + univ) + exper, data = twoyear))

Call:
lm(formula = lwage ~ jc + I(jc + univ) + exper, data = twoyear)

Residuals:
     Min       1Q   Median       3Q      Max 
-2.10362 -0.28132  0.00551  0.28518  1.78167 

Coefficients:
               Estimate Std. Error t value Pr(>|t|)    
(Intercept)   1.4723256  0.0210602  69.910   <2e-16 ***
jc           -0.0101795  0.0069359  -1.468    0.142    
I(jc + univ)  0.0768762  0.0023087  33.298   <2e-16 ***
exper         0.0049442  0.0001575  31.397   <2e-16 ***
---
Signif. codes:  0 '***' 0.001 '**' 0.01 '*' 0.05 '.' 0.1 ' ' 1

Residual standard error: 0.4301 on 6759 degrees of freedom
Multiple R-squared:  0.2224,    Adjusted R-squared:  0.2221 
F-statistic: 644.5 on 3 and 6759 DF,  p-value: < 2.2e-16

Testing Multiple Linear Restrictions

Testing multiple restrictions

  • The \(t\)-test is used to test a hypothesis about a single population parameter \(\beta_j\)
  • The \(F\)-test is used to test multiple hypotheses about multiple population parameters jointly
  • Example: \(\log (\text { salary }_i )= \beta_0+\beta_1 \text { years }_i +\beta_2 \text { gamesyr }_i +\beta_3 \text { bavg }_i +\beta_4 \text { hrunsyr }_i +\beta_5 \text { rbisyr }_i +u_i\)
    • \(\mathrm{H}_0: \beta_3=0, \beta_4=0, \beta_5=0\)
    • \(\mathrm{H}_1:\) \(H_0\) is not true: At least one of \(\beta_3, \beta_4, \beta_5\) is not zero

library(wooldridge)
summary(lm(log(salary) ~ years + gamesyr + bavg + hrunsyr + rbisyr, data = mlb1))

Call:
lm(formula = log(salary) ~ years + gamesyr + bavg + hrunsyr + 
    rbisyr, data = mlb1)

Residuals:
     Min       1Q   Median       3Q      Max 
-3.02508 -0.45034 -0.04013  0.47014  2.68924 

Coefficients:
             Estimate Std. Error t value Pr(>|t|)    
(Intercept) 1.119e+01  2.888e-01  38.752  < 2e-16 ***
years       6.886e-02  1.211e-02   5.684 2.79e-08 ***
gamesyr     1.255e-02  2.647e-03   4.742 3.09e-06 ***
bavg        9.786e-04  1.104e-03   0.887    0.376    
hrunsyr     1.443e-02  1.606e-02   0.899    0.369    
rbisyr      1.077e-02  7.175e-03   1.500    0.134    
---
Signif. codes:  0 '***' 0.001 '**' 0.01 '*' 0.05 '.' 0.1 ' ' 1

Residual standard error: 0.7266 on 347 degrees of freedom
Multiple R-squared:  0.6278,    Adjusted R-squared:  0.6224 
F-statistic: 117.1 on 5 and 347 DF,  p-value: < 2.2e-16
  • Based on what we have learned so far, what do we think about \(\mathrm{H}_0: \beta_3=0, \beta_4=0, \beta_5=0\)?

Let us run both models

Unrestricted model

library(wooldridge)
unrestricted <-  lm(log(salary) ~ years + gamesyr + bavg + hrunsyr + rbisyr, data = mlb1)
summary(unrestricted)

Call:
lm(formula = log(salary) ~ years + gamesyr + bavg + hrunsyr + 
    rbisyr, data = mlb1)

Residuals:
     Min       1Q   Median       3Q      Max 
-3.02508 -0.45034 -0.04013  0.47014  2.68924 

Coefficients:
             Estimate Std. Error t value Pr(>|t|)    
(Intercept) 1.119e+01  2.888e-01  38.752  < 2e-16 ***
years       6.886e-02  1.211e-02   5.684 2.79e-08 ***
gamesyr     1.255e-02  2.647e-03   4.742 3.09e-06 ***
bavg        9.786e-04  1.104e-03   0.887    0.376    
hrunsyr     1.443e-02  1.606e-02   0.899    0.369    
rbisyr      1.077e-02  7.175e-03   1.500    0.134    
---
Signif. codes:  0 '***' 0.001 '**' 0.01 '*' 0.05 '.' 0.1 ' ' 1

Residual standard error: 0.7266 on 347 degrees of freedom
Multiple R-squared:  0.6278,    Adjusted R-squared:  0.6224 
F-statistic: 117.1 on 5 and 347 DF,  p-value: < 2.2e-16
sum(unrestricted$residuals^2)
[1] 183.1863

Restricted model

library(wooldridge)
restricted <-  lm(log(salary) ~ years + gamesyr, data = mlb1)
summary(restricted)

Call:
lm(formula = log(salary) ~ years + gamesyr, data = mlb1)

Residuals:
     Min       1Q   Median       3Q      Max 
-2.66858 -0.46412 -0.01177  0.49219  2.68829 

Coefficients:
             Estimate Std. Error t value Pr(>|t|)    
(Intercept) 11.223804   0.108312 103.625  < 2e-16 ***
years        0.071318   0.012505   5.703  2.5e-08 ***
gamesyr      0.020174   0.001343  15.023  < 2e-16 ***
---
Signif. codes:  0 '***' 0.001 '**' 0.01 '*' 0.05 '.' 0.1 ' ' 1

Residual standard error: 0.7527 on 350 degrees of freedom
Multiple R-squared:  0.5971,    Adjusted R-squared:  0.5948 
F-statistic: 259.3 on 2 and 350 DF,  p-value: < 2.2e-16
sum(restricted$residuals^2)
[1] 198.3115
  • Is the increase in SSR large enough to reject the null hypothesis?
  • But what is the test statistic that we can use?

The F-test

  • \(y_i = \beta_0 + \beta_1 x_{1i} + \beta_2 x_{2i} + \ldots + \beta_k x_{ki} + u_i\)
  • Hypotheses Test of \(q\) exclusion restrictions
    • \(H_0: \beta_{k-q} = \beta_{k-q+1} = \ldots = \beta_k = 0\)
    • \(H_1:\) At least one of \(\beta_{k-q}, \beta_{k-q+1}, \ldots, \beta_k\) is not zero
  • Test statistic: \(F = \frac{(SSR_r - SSR_{ur})/q}{SSR_{ur}/(n-k-1)}\)
    • Can bee re-written as \(\frac{(R^2_{UR} - R^2_R)/q}{(1 - R^2_{UR})/(n-k-1)}\)
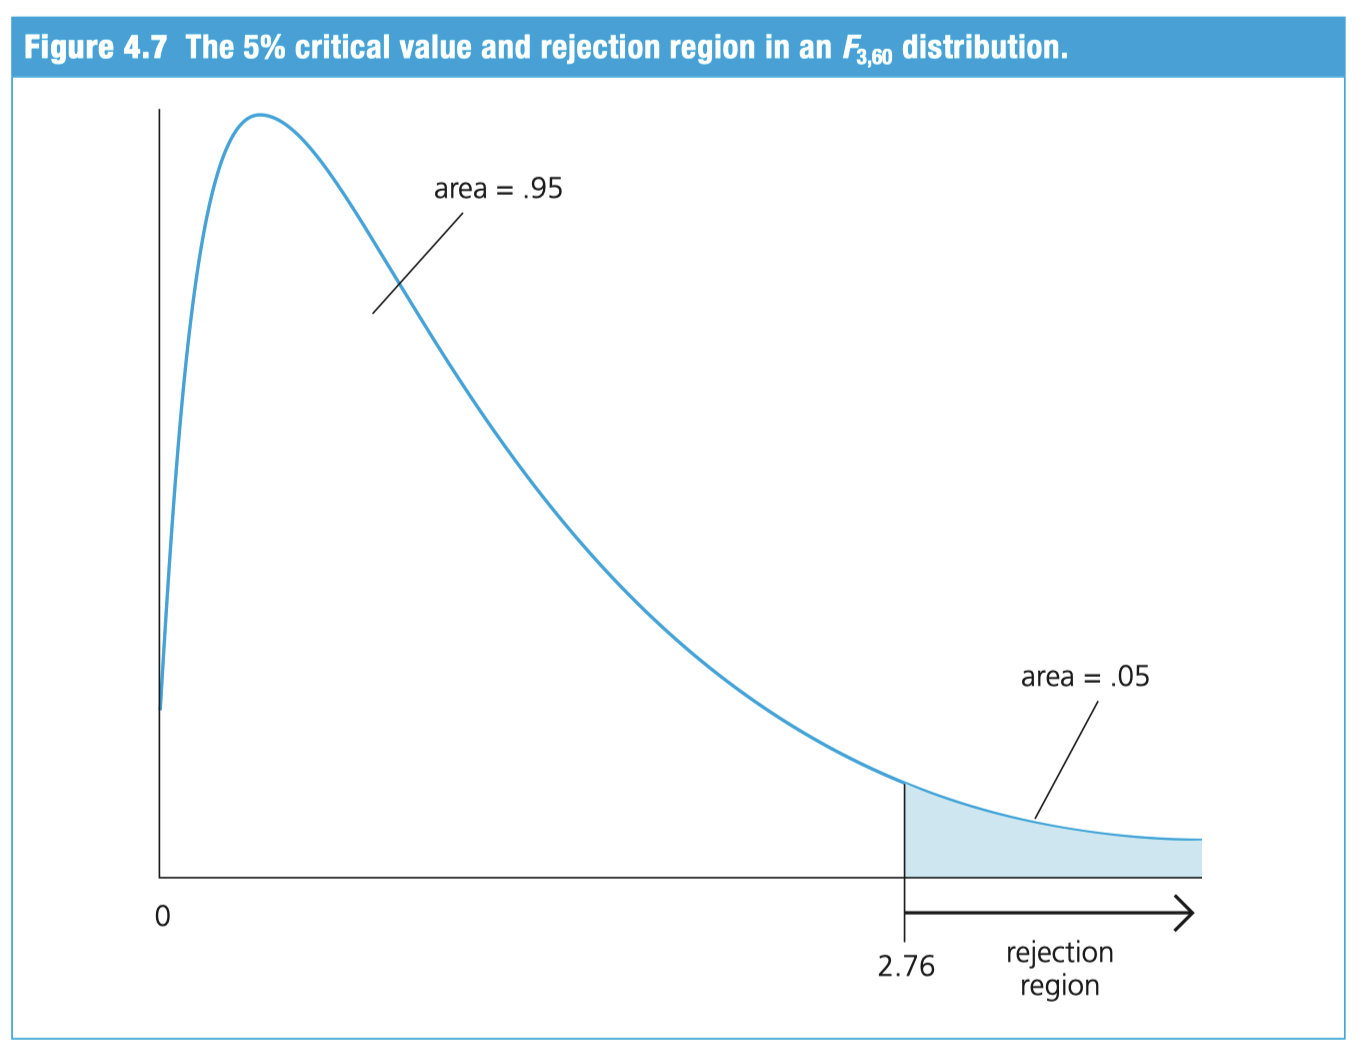
    • Follows an \(F\)-distribution with \(q\) and \(n-k-1\) d.o.f.
    • Note:
      • \(q = dof_r - dof_{ur}\)
      • F > 0

Example F sampling distribution

Going back to the example

\(\log(salary_i)= \beta_0+\beta_1 years_i +\beta_2 gamesyr_i +\beta_3 bavg_i +\beta_4 hrunsyr_i +\beta_5 rbisyr_i +u_i\)

  • \(\mathrm{H}_0: \beta_3=0, \beta_4=0, \beta_5=0\)
  • \(\mathrm{H}_1:\) \(H_0\) is not true.
library(wooldridge)
unrestricted <-  lm(log(salary) ~ years + gamesyr + bavg + hrunsyr + rbisyr, data = mlb1)
restricted <-  lm(log(salary) ~ years + gamesyr, data = mlb1)
F_stat <- ((sum(restricted$residuals^2) - sum(unrestricted$residuals^2))/3)/(sum(unrestricted$residuals^2)/(nrow(mlb1) - 5-1))
print(F_stat)
[1] 9.550254
critical_F <- qf(0.05, df1 = 3, df2 = nrow(mlb1) - 5-1, lower.tail = F)
print(critical_F)
[1] 2.630641
if (F_stat > critical_F) {
  print("Reject H0")
} else {
  print("Fail to reject H0")
}
[1] "Reject H0"

\(\log(salary_i)= \beta_0+\beta_1 years_i +\beta_2 gamesyr_i +\beta_3 bavg_i +\beta_4 hrunsyr_i +\beta_5 rbisyr_i +u_i\)

  • But recall when we ran the unrestricted model, we found that \(\beta_3, \beta_4, \beta_5\) were not statistically significant.
  • So, whats going on here with the joint F-test?
  • \(hrunsyr\) and \(rbisyr\) are highly correlated.
    • multicollinearity \(\rightarrow\) large standard errors \(\rightarrow\) low t-stats \(\rightarrow\) individual statistical insignificance
  • The F-test is a joint test (including bavg) and is not affected by multicollinearity
  • Hence F-tests of joint hypotheses can be useful in the presence of multicollinearity

Relationship between t and F tests

  • For a single restriction \(q=1\), the F-test is equivalent to the t-test
    • \(F_{1,n-k-1} = t^2_{n-k-1}\)
  • For single hypothesis testing, the t-test is more powerful
    • F-tests remain under-powered than t-tests (See Math refresher C)

Reporting Regression Results

  • Report Estimated Coefficients
    • Interpret key variables’ estimates in economic or practical terms.
  • Include Standard Errors
    • Preferred over just \(t\)-statistics as they help interpret hypothesis tests and confidence intervals.
  • Report \(R^2\) and Other Fit Statistics
    • \(R^2\) is essential for goodness-of-fit.
    • Reporting F-statistics helps test exclusion restrictions.
  • Summarize in Tables for Multiple Models
    • If multiple equations are estimated, use tables instead of inline equations.
    • Dependent variable should be clearly indicated.
    • Independent variables should be listed in the first column.
    • Standard errors in parentheses below estimates.

Salary and Benefits Tradeoff example

  • Total compensation (\(totcomp\)) consists of salary and benefits:\[totcomp = salary + benefits = salary \left( 1 + \frac{benefits}{salary} \right)\]
  • Taking the log transformation: \(\log(totcomp) = \log(salary) + \log(1 + b/s).\)
  • For small \(b/s\), can approximate \(\log(1 + b/s) \approx b/s.\)
  • This leads to the econometric model:\[\log(salary) = \beta_0 + \beta_1 (b/s) + \text{other *controls*}. \]
  • Hypothesis Test: Testing the salary-benefits tradeoff:
    • \(H_0: \beta_1 = -1\) (full tradeoff)
    • \(H_1: \beta_1 \neq -1\) (partial or no tradeoff)
  • Data from MEAP93 controls for enrollment, staff size, dropout, and graduation rates.

library(stargazer, wooldridge)
model1 <- lm(log(salary) ~ I(benefits/salary), data = meap93)
model2 <- lm(log(salary) ~ I(benefits/salary) + I(log(enroll)) + I(log(staff)), data = meap93)
model3 <- lm(log(salary) ~ I(benefits/salary) + I(log(enroll)) + I(log(staff)) + droprate + gradrate, data = meap93)

stargazer(model1, model2, model3, 
          type = "text", 
          title = "Regression Results",
          omit.stat = c("ser"), # Omit some stats if needed
          dep.var.labels = "Log(salary)",
          column.labels = c("Model 1", "Model 2", "Model 3"),
          covariate.labels = c("benefits to salary ratio", "log of enrollment", "log of staff", "Drop out rate", "Graduation rate", "Intercept"))

Regression Results
================================================================================================
                                                   Dependent variable:                          
                         -----------------------------------------------------------------------
                                                       Log(salary)                              
                                 Model 1                 Model 2                 Model 3        
                                   (1)                     (2)                     (3)          
------------------------------------------------------------------------------------------------
benefits to salary ratio        -0.825***               -0.605***               -0.589***       
                                 (0.200)                 (0.165)                 (0.165)        
                                                                                                
log of enrollment                                       0.087***                0.088***        
                                                         (0.007)                 (0.007)        
                                                                                                
log of staff                                            -0.222***               -0.218***       
                                                         (0.050)                 (0.050)        
                                                                                                
Drop out rate                                                                    -0.0003        
                                                                                 (0.002)        
                                                                                                
Graduation rate                                                                   0.001         
                                                                                 (0.001)        
                                                                                                
Intercept                       10.523***               10.844***               10.738***       
                                 (0.042)                 (0.252)                 (0.258)        
                                                                                                
------------------------------------------------------------------------------------------------
Observations                       408                     408                     408          
R2                                0.040                   0.353                   0.361         
Adjusted R2                       0.038                   0.348                   0.353         
F Statistic              17.050*** (df = 1; 406) 73.386*** (df = 3; 404) 45.428*** (df = 5; 402)
================================================================================================
Note:                                                                *p<0.1; **p<0.05; ***p<0.01

modelsummary package

library(modelsummary)
models <- list(
  "Model 1" = model1,
  "Model 2" = model2,
  "Model 3" = model3
)
modelsummary(models, stars = TRUE, output = "markdown")
Model 1 Model 2 Model 3
+ p < 0.1, * p < 0.05, ** p < 0.01, *** p < 0.001
(Intercept) 10.523*** 10.844*** 10.738***
(0.042) (0.252) (0.258)
I(benefits/salary) -0.825*** -0.605*** -0.589***
(0.200) (0.165) (0.165)
I(log(enroll)) 0.087*** 0.088***
(0.007) (0.007)
I(log(staff)) -0.222*** -0.218***
(0.050) (0.050)
droprate -0.000
(0.002)
gradrate 0.001
(0.001)
Num.Obs. 408 408 408
R2 0.040 0.353 0.361
R2 Adj. 0.038 0.348 0.353
AIC 8070.3 7913.7 7912.4
BIC 8082.4 7933.7 7940.5
Log.Lik. 192.417 272.763 275.397
F 17.050 73.386 45.428
RMSE 0.15 0.12 0.12